See your whole business in one living view.
Business World turns your real orders, cash, stock, customers, and team into a 3D map you can read at a glance — activity as tower height, health as color, a beacon on whatever needs you first, and a live operations campus that shows every location, who's on the clock, and what moved today.
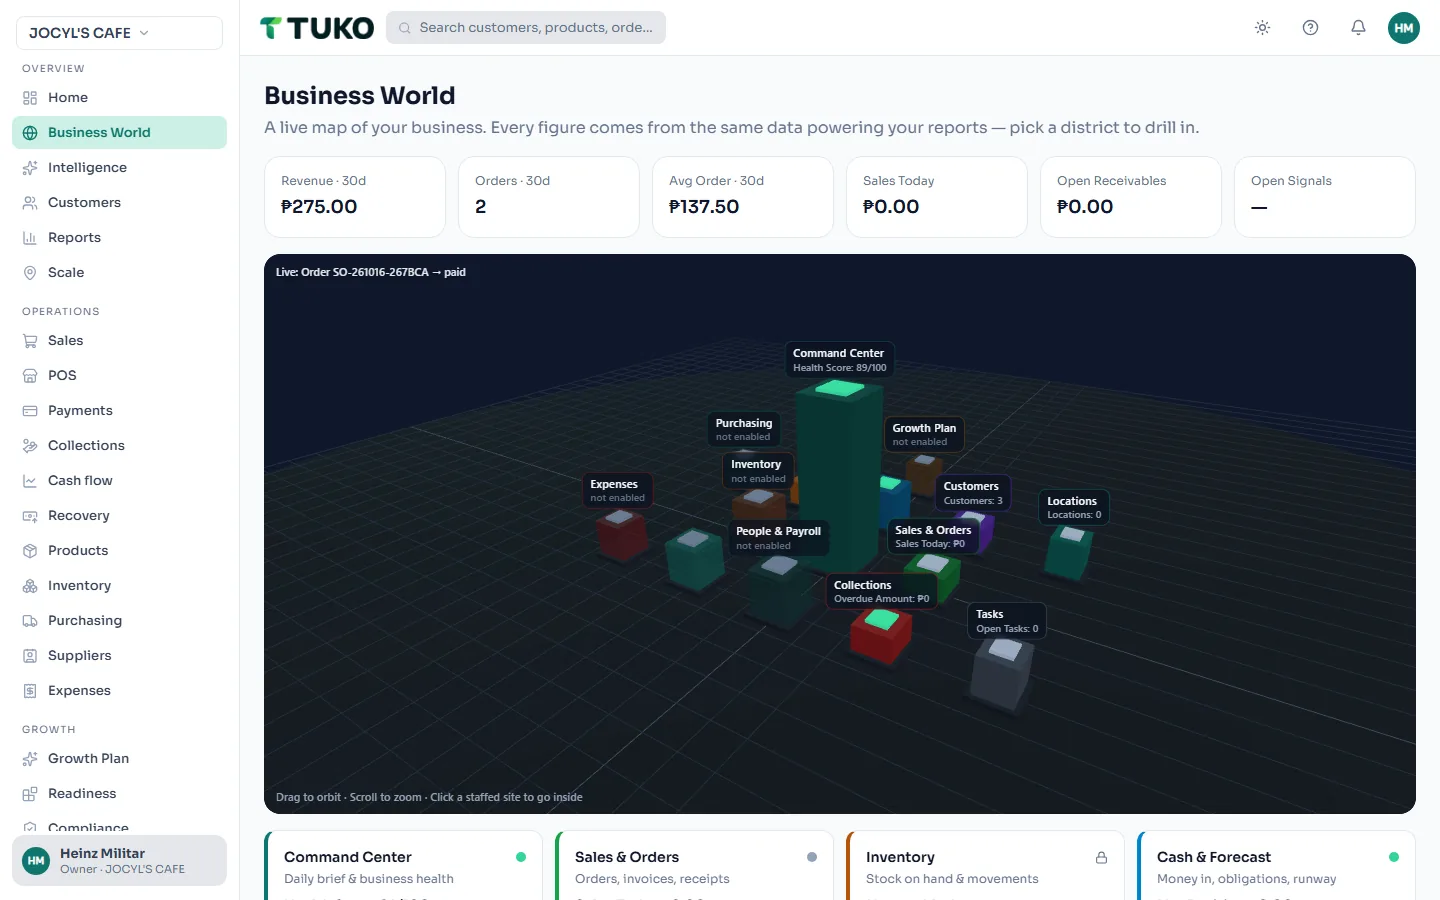


One map, fourteen districts — each drawn from records you already keep.
Look. Understand. Open.
The whole view runs on data you already have — nothing new to wire up, nothing new to type in.
Look
Fourteen districts — command, sales, stock, cash, customers, collections, POS, people, purchasing, expenses, locations, tasks, pulse, growth — rise as towers on one map. Height is activity for the period; cap color is health; a beacon means something needs you.
Understand
Select a district, a site, or a person and the panel shows the real records behind the shape — amounts, counts, and trends with evidence. Estimated values are labeled "est." and never blended into observed numbers.
Open
Every district links straight into the module that owns its data — Reports, Cash Flow, Inventory, Customers, HR, Scale. The world is a map to your business, not a dead-end dashboard.
Built for the owner who can't be in three places at once.
Reports tell you yesterday. The check-in call tells you what staff think you want to hear. The world shows you now.
Checking in today looks like
- Messaging the store and weighing "okay naman" against what you suspect.
- Waiting for the end-of-day count to learn how today actually went.
- Finding out tomorrow that a register opened late or a delivery never landed.
- Choosing between hovering over every site — or flying blind over all of them.
Checking in with the world looks like
- Opening one map and seeing every site's activity, stock, and who's on the clock.
- Watching an order or transfer pulse at the site where it happened — as it happens.
- Spotting the quiet district or the lit beacon before anyone phones it in.
- Tapping the thing that looks off and landing inside the module that owns it.
Your staff keep working in the same app — the world simply draws the records they already make. No new data entry, no extra step for the team.
Every shape means something real.
No decoration — the geometry itself is your data, and missing data never pretends to be zero.
Height = activity
A busy district stands tall. A quiet one stays low. Compare districts at a glance instead of cross-referencing five reports.
Color = health
The cap of each tower reflects the health your records already compute — healthy, watch, or needs attention — same grading, new vantage point.
Beacon = needs you
When Business Pulse raises a signal in a district, its beacon lights. You see where attention is owed before you read a single alert.
Dimmed = not yours
Districts outside your permissions render subdued — visible as part of the business, honest about being out of reach. Locked, never leaked.
Inactive = no data yet
A district with no records renders inactive — never a fake flatline that looks like "zero sales". TUKO reports insufficient data honestly.
Accessible to everyone
No WebGL? Screen reader? Reduced motion? A complete directory lists every district, metric, and alert as plain structured content — same truth, every device.
A live campus for the business you're running right now.
Past the district towers sits the operations campus — today's activity, drawn from the same records, the moment it's recorded.
Every location, standing
Your HQ, branches, kiosks, and warehouses each get a real building — sized by today's activity, with a stock bar showing units on hand where that site holds inventory.
Who's on the clock
Staff who punched in today appear inside their site — working or timed out, with open-register cashiers highlighted. Step inside a staffed site to see the team. Names follow your existing permissions.
Stock in motion
Completed transfers arc between the sites they actually moved between — real movement pairs from your inventory ledger, never a pretend "in transit" that doesn't exist.
Activity as it happens
Orders, punches, register opens, and transfers pulse at the site where they happened — and stream through a live ticker and the operations board underneath the map.
The board beside the map
A live operations panel lists every site, every person on the clock, every transfer, and the activity feed as plain, selectable rows — the same truth, readable by anyone on any device.
Honest when empty
No locations configured? The campus says so plainly — never a fake skyline. A restricted roster reports "unknown" headcount, not a wrong zero.
Your data, not a demo
Business World is a presentation layer over the records already in your workspace — orders, payments, stock, expenses, customers, attendance, register sessions, inventory transfers, and locations. It queries the same organization-scoped services as your reports, under the same row-level security and the same permissions.
It cannot change a number, write a record, or show you data from outside your organization. When a source is unavailable the district shows it; when a value is estimated it stays labeled. The view is honest or it doesn't render.
Light on your machine, heavy on insight.
Built to run in an ordinary browser tab without draining your day.
What it does
- Pauses rendering the moment the tab is hidden — no silent battery burn.
- Caps pixel density so it stays smooth on high-resolution and modest screens alike.
- Respects reduced-motion settings — animation calms or stops to match your preference.
- Data refreshes reshape existing towers instead of rebuilding the world.
What it never does
- Never blocks the app — the world loads after your workspace, never before it.
- Never fabricates data for a prettier picture — unavailable stays unavailable.
- Never leaves you stranded without WebGL — the full directory works everywhere.
- Never bypasses permissions — restricted districts stay restricted.
The 3D view is opt-in per workspace and can be switched off; the district directory is always available either way.
A Help Center in every workspace
Business World — like the rest of TUKO — ships with a built-in guide. Searchable help articles and quick guides live under the ? icon in the top bar and Help in the sidebar, so the answer is in the same app as the question.
Business World questions, answered
Where does the Business World get its data?
From the same organization-scoped records that power your reports — orders, payments, inventory, expenses, customers, attendance, and locations. The world is a presentation layer: it never invents numbers, never writes back to your data, and shows "no data yet" instead of fake zeros when a district has nothing to report.
Do I need a powerful device or special hardware?
No. The 3D view runs in a normal web browser on any reasonably modern laptop, tablet, or desktop. If WebGL is unavailable — or you prefer it — an accessible directory lists every district with the same metrics, health, and alerts as plain text that works with screen readers and reduced-motion settings.
What do the towers, colors, and beacons mean?
Each district is a part of your business — money, sales, stock, customers, people, locations. Tower height shows activity level for the period, cap color shows health from your own records, and a beacon marks a district that has alerts needing attention. Restricted areas render dimmed; unavailable ones show as inactive rather than zero.
Can I open the details behind a district?
Yes. Select any district — by tapping a tower or picking it from the directory — and a panel shows its key metrics with evidence, plus a link into the underlying module (Reports, Cash Flow, Inventory, Customers, HR, Scale). The world is a map, not a dead end.
What does the live operations layer show?
Every real location configured in your workspace — HQ, branches, kiosks, warehouses — stands as its own building in the operations campus, sized by how busy it is today with a stock bar showing units on hand. Staff who punched in today appear inside their site; cashiers with an open register are highlighted. Completed stock transfers draw arcs between sites, and a live activity feed pulses at the site where each event happened. Selecting a staffed site lets you step inside it.
Can anyone see who is on the clock and where?
Only people your permissions already allow. The world reads attendance, sessions, and rosters through the same permission-checked services as the HR and POS screens — row-level security still decides which rows exist for each viewer. When a workspace restricts employee visibility, names are masked to roles like "Staff member" and headcounts report as unknown instead of a misleading number. Presence states are honest: someone is working or timed out, never an inferred break.
Is my business data still secure in the 3D view?
Completely. The world reads through the same authenticated, permission-checked services as every other screen. Districts you don't have access to stay locked, row-level security is unchanged, and estimated values stay labeled "est." — never blended into observed metrics.

Your business, visible at a glance.
See the plans, or read the common questions first.
Free to start · No credit card required · Works on web, iOS, and Android